Delhi and around, 1975–2030
Where did Delhi NCR's new people go?
Most of the new building since 1975 happened outside Delhi itself.
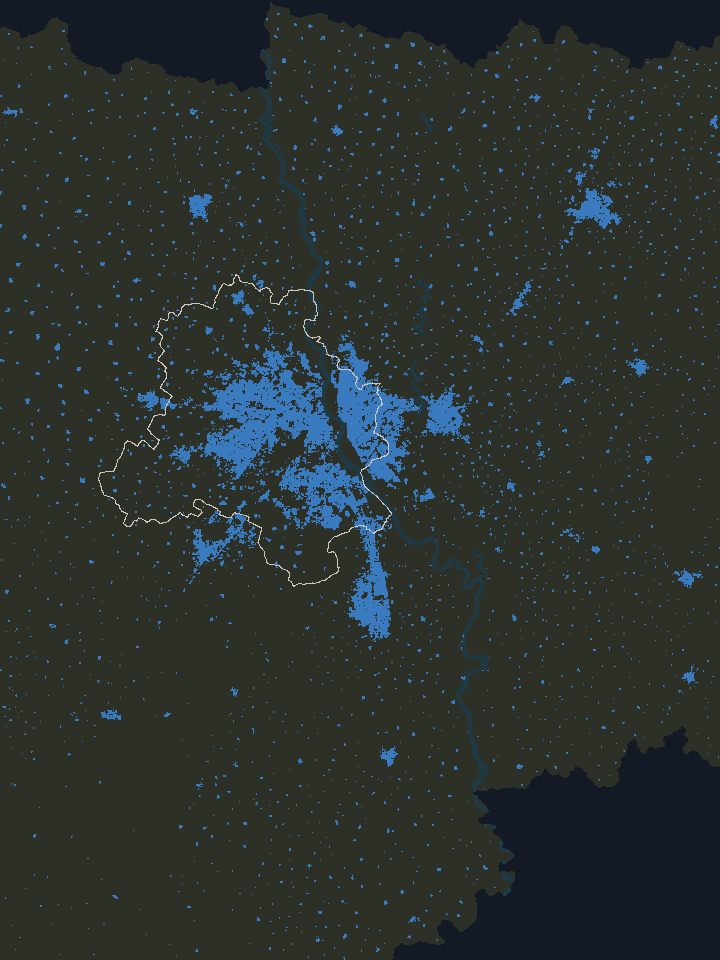
I moved to Delhi NCR three years ago from a decently big city in western India, and I was amazed by the sheer breadth of continuous urban sprawl, from the old cores of New Delhi and Old Delhi all the way out to the edges of the neighbouring cities in UP and Haryana. I had a lot of questions about how it grew so big, and in what manner. When I started making this map, I didn’t know what kind of insights would come out of it.
If you’ve lived in Delhi NCR for a while, someone has probably told you about a field, usually the one their house now stands on. Dwarka was farmland and villages until the DDA began building it around 1990, Noida didn’t exist until 1976 and Greater Noida until 1991, and within living memory the road out to Gurgaon ran past fields.
Each of us knows a few of these stories. I wanted to see all of them together on one map, across the whole region and every year since 1975.
- Built by 1975
- 1975–1990
- 1990–2000
- 2000–2015
- 2015–2020
- After 2020
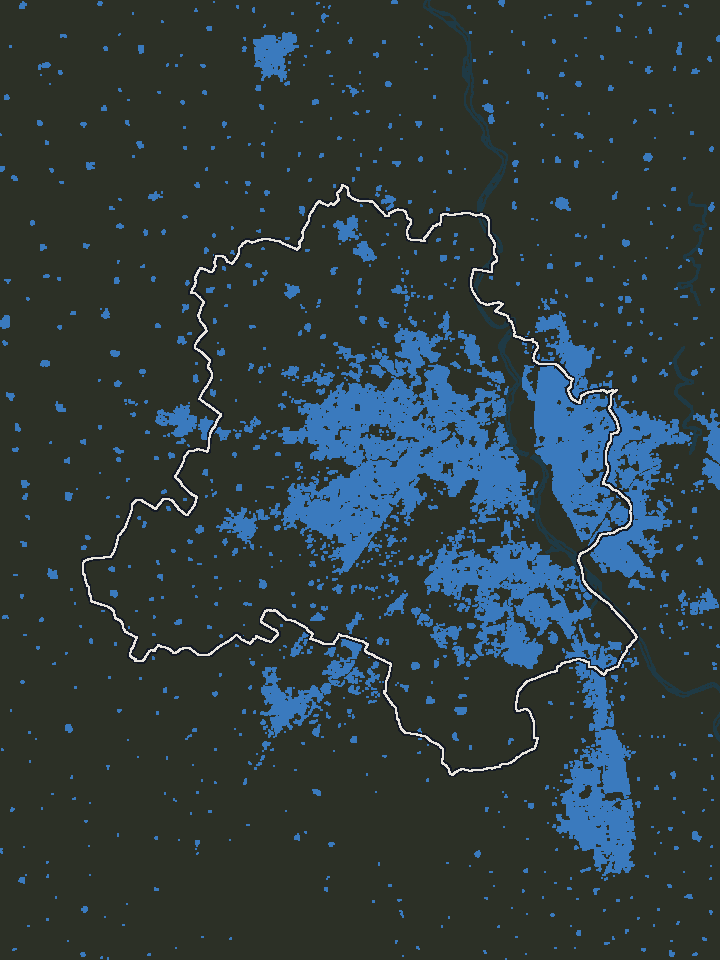
This is the region in 1975. Each coloured square is 100 metres of land that was already built up, and the blue patch in the middle is Delhi. Most of the rest is farmland, with small towns along the highways and villages scattered between them.
Since then, about 36 million more people have come to live here, and every one of them needed room. A city can make room in two ways: it can fit more people onto the land it already has, or it can build on new land around its edges. Delhi NCR did both, in different places, and which places did which wasn’t quite what I expected.
Reading the map
Each column on this map stands on one square of land, 100 metres a side, and you read it by its colour and its height.
Its colour tells you when that land was first built up: blue if it already was by 1975, then purple, pink and orange through the decades, and yellow for the newest land, built up after 2020. A square counts as built up once buildings cover more than a fifth of it. After that, its colour never changes.
Its height tells you how many people live around it, as people per km² in the 500-metre square centred on it. Unlike the colour, the height keeps changing, and as more people move in, the column rises.
One column stands on a square of land 100 metres a side. Its colour is when that land was first built up; its height is how many people live in the 500-metre square around it (the faint grid). This one stands for 30,000 people per km², so it is 300 m tall.
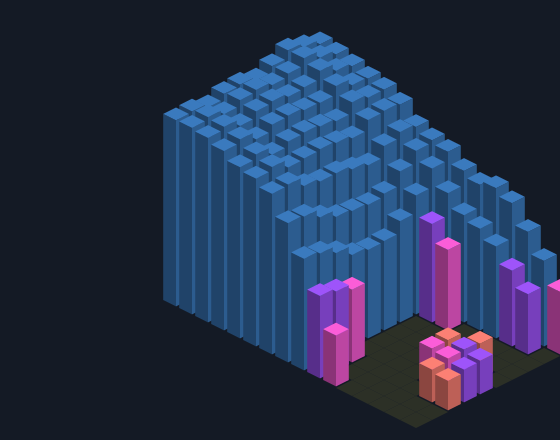
A neighbourhood: 1.6 km by 1 km in 2020, from the empty Yamuna floodplain in front up into Brijpuri, North East Delhi: old land, densely lived on, rising in one step from the river.
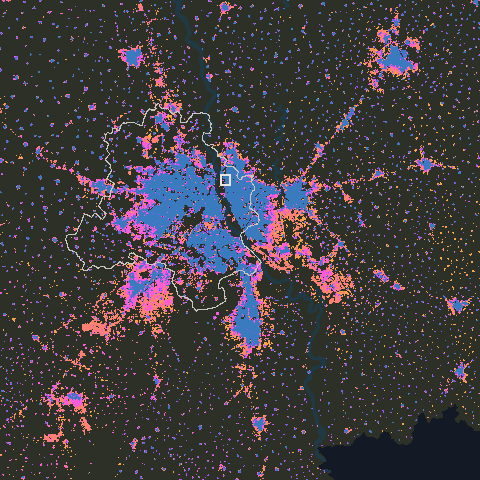
The city: the whole region in 2020, seen from above; the small square is the neighbourhood.
- Built by 1975
- 1975–1990
- 1990–2000
- 2000–2015
- 2015–2020
- After 2020
So a tall blue column is old land that has filled up, and a short orange one is new land that few people live on yet. After a minute or so you start reading them without thinking about it.
Fifty-five years
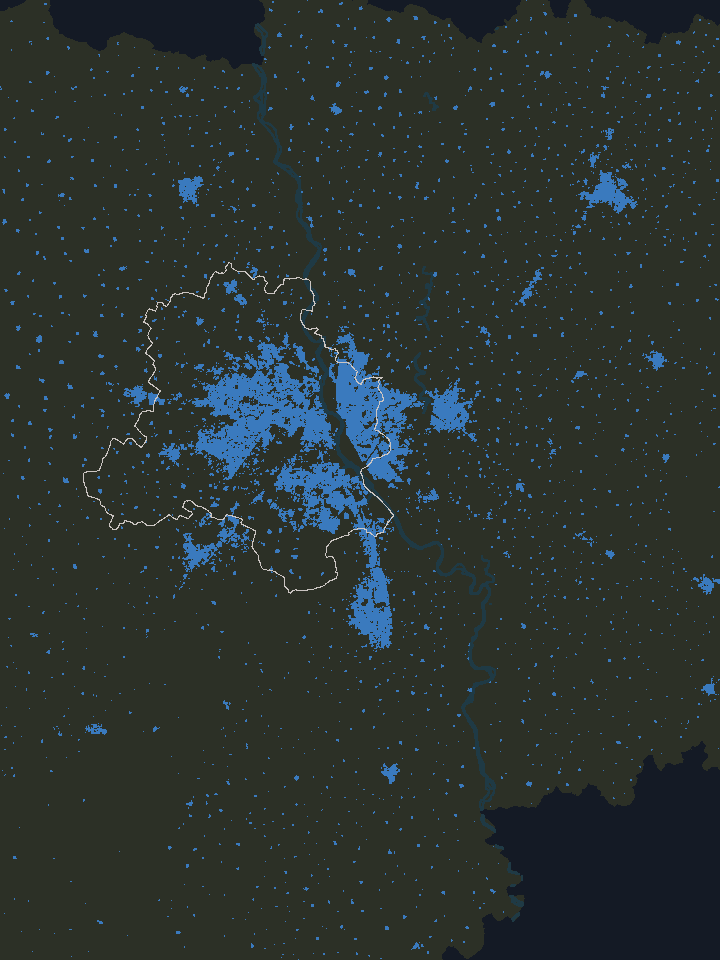
1975 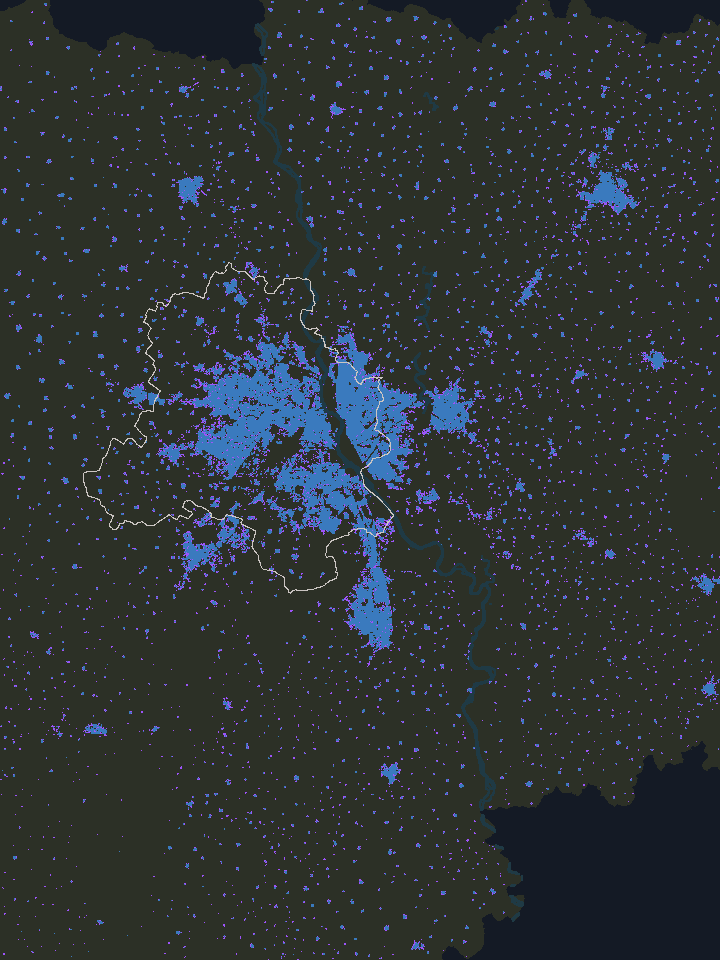
1990 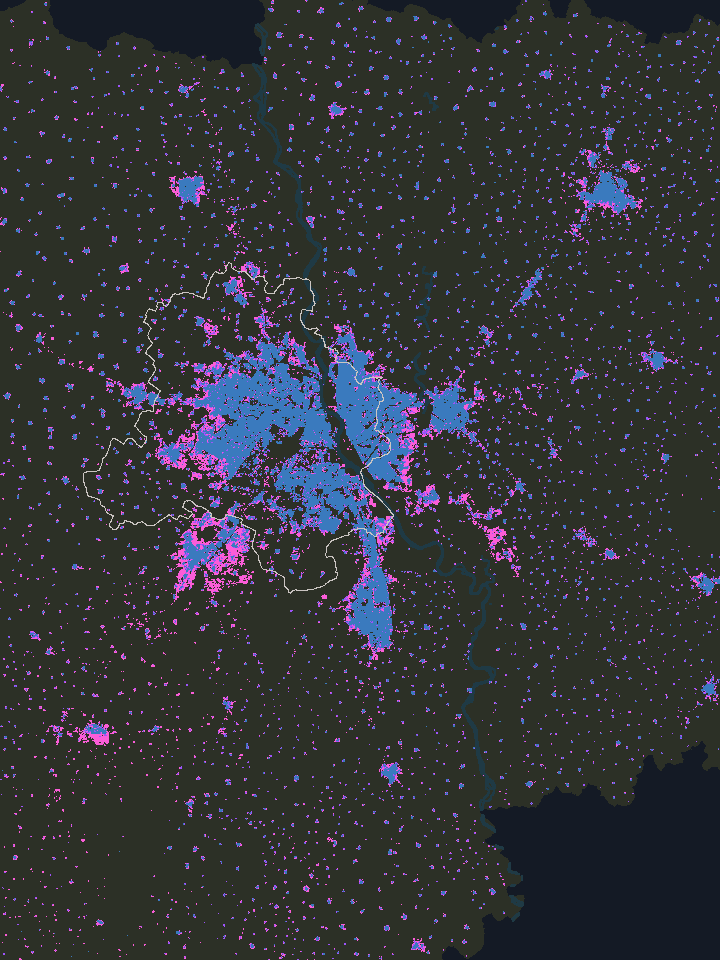
2000 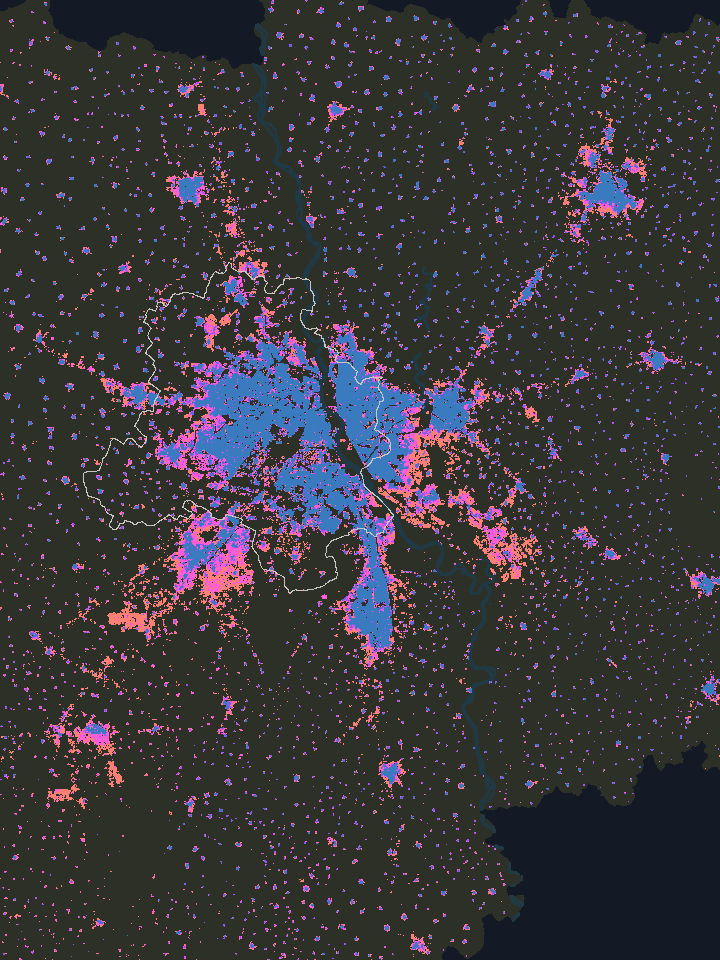
2015 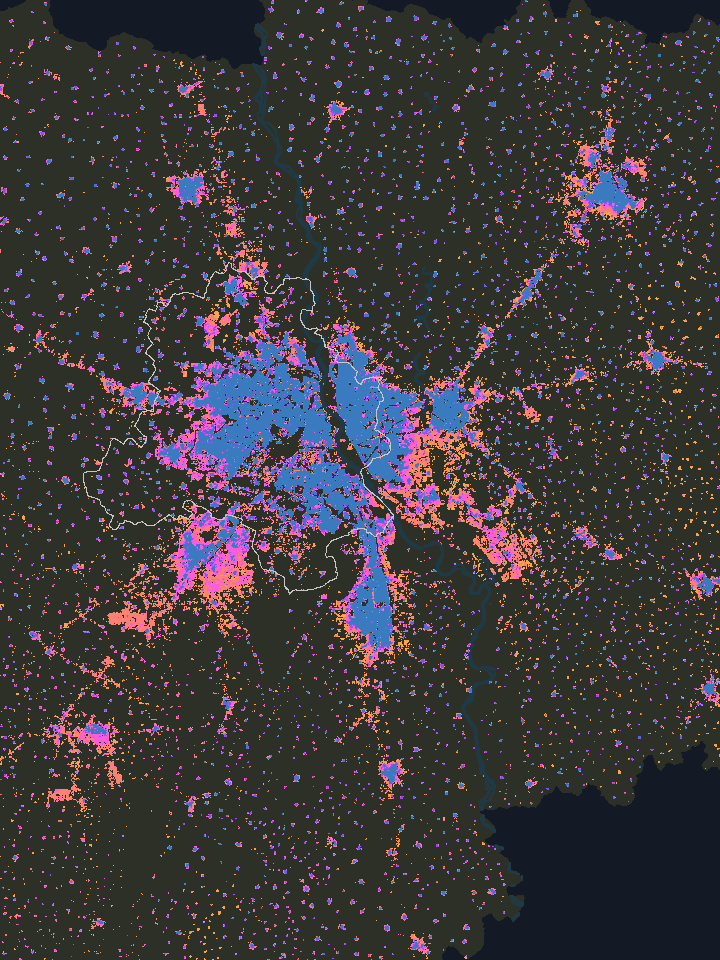
2020 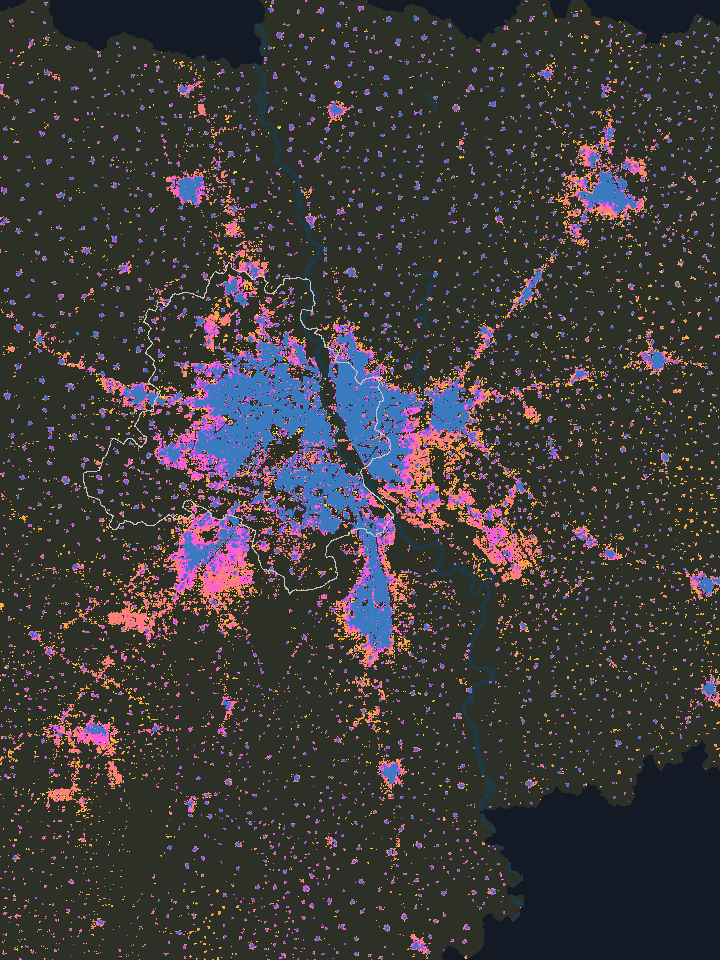
2030 (forecast)
- Built by 1975
- 1975–1990
- 1990–2000
- 2000–2015
- 2015–2020
- After 2020
1975. Delhi is one blue mass west of the Yamuna: Old Delhi, the bungalows of New Delhi, and the colonies built for refugees after Partition, from Rajinder Nagar to Lajpat Nagar. Across the river, most of the east bank from Shahdara northwards is already built up. Further out, Faridabad’s industrial town sits on the Mathura Road, Ghaziabad on the old GT Road, and Gurgaon is a small farming town surrounded by fields.
1990. The land built up in the 1980s is spread around Delhi’s outer edge, to the north, the south-west and the south, rather than in one place. In Gurgaon it appears beside the old town, where the first private colonies of the DLF phases began.
2000. Land built up in the 1990s fills in towards the south-west, where Dwarka is going up on what was farmland. Across the border in Ghaziabad, Vasundhara appears almost touching East Delhi. Noida pushes south along the river. In Gurgaon, most of the DLF phases and Golf Course Road fill in during these years. Greater Noida exists on paper; on the map it’s still a scatter.
2015. Gurugram spreads along Sohna Road and the Dwarka Expressway, sector after sector reaching towards the Aravallis. The towers of Greater Noida West rise out of fields. Delhi still adds new land, more of it than Gurugram in these years, but little for a city its size, and North East Delhi’s columns keep climbing.
2020. These five years add more new built-up land across the map than any other five, about 300 km². Some of it is at the edges: the new Gurugram sectors along the Dwarka Expressway, Greater Faridabad across the canal, Greater Noida stretching along the Yamuna Expressway. More of it is inside Delhi, Noida and Ghaziabad.
2025 and 2030. The last colours are GHSL’s projections, so read them as a forecast, not a record.
While the years run, watch the middle and the edges. In the middle the colours change slowly but the columns keep rising, and around the edges new colours keep arriving.
Inside Delhi
Look at Delhi in 2020: nearly three quarters of its built-up land was already built up by 1990. Between 2000 and 2020, Delhi’s built-up land grew by only about a sixth. Its people grew by nearly half.
So the new people went into the city that was already there, by building upward and filling every gap. Today Delhi holds about 31,500 people on each km² of its built-up land. Ghaziabad, the densest of its neighbours, holds about 22,500, and Greater Noida under 4,000.
People per km² of built-up land, 1975 to 2030
The numbers
| Place | 1975 | 1980 | 1985 | 1990 | 1995 | 2000 | 2005 | 2010 | 2015 | 2020 | 2025 | 2030 |
|---|---|---|---|---|---|---|---|---|---|---|---|---|
| Delhi | 11,693 | 13,548 | 15,944 | 18,718 | 21,269 | 24,258 | 26,109 | 27,458 | 29,174 | 31,455 | 33,279 | 34,921 |
| Ghaziabad | 7,287 | 8,318 | 9,738 | 11,394 | 13,144 | 15,683 | 17,940 | 19,906 | 21,784 | 22,485 | 23,642 | 24,697 |
| Faridabad | 10,945 | 11,428 | 11,929 | 12,463 | 12,729 | 13,483 | 14,650 | 15,524 | 16,103 | 15,681 | 16,005 | 16,465 |
| Noida | 7,483 | 8,140 | 8,998 | 9,976 | 10,789 | 12,296 | 12,998 | 13,008 | 13,264 | 12,811 | 13,340 | 13,864 |
| Gurugram | 4,941 | 5,264 | 5,632 | 6,158 | 5,397 | 5,792 | 6,690 | 7,541 | 8,386 | 8,793 | 9,239 | 9,653 |
| Greater Noida | 8,437 | 7,208 | 6,193 | 5,651 | 4,851 | 4,897 | 4,653 | 4,470 | 4,382 | 3,948 | 3,962 | 4,050 |
Delhi is the National Capital Territory of Delhi, all 13 of its districts. Ghaziabad is Ghaziabad tehsil. Faridabad is Faridabad tehsil. Noida is Dadri tehsil, which the map calls Noida. Gurugram is Gurgaon tehsil. Greater Noida is Gautam Buddha Nagar tehsil, which the map calls Greater Noida.
The extreme is across the Yamuna, in the north-east. North East Delhi district (Seelampur, Brijpuri, Bhajanpura, Mustafabad) holds about 42,700 people on each km² of all its land, more than any other district on the map. Within a kilometre of Brijpuri, the figure reaches about 80,000, the highest of any named place on the map. The density there comes from houses of three and four storeys on narrow lanes, built plot by plot. Some of these neighbourhoods began as resettlement colonies, others as unauthorised colonies that grew before any plan reached them.
Only about 5% of people in Delhi live on land that was built up after 2000. If you live in Delhi, your home is almost certainly on land that was already a city by then, land that simply holds more people every year.
Around Delhi
Now look at the edges. From 2000 to 2020, the five neighbours on this map (Ghaziabad, Faridabad, Noida, Gurugram and Greater Noida) took about 72% of the new built-up land, but only 37% of the new people.
Where the new land and the new people went, 2000 to 2020
The numbers
| Place | New built-up land | New people |
|---|---|---|
| Delhi | 28% | 63% |
| Ghaziabad | 10% | 14% |
| Faridabad | 10% | 7% |
| Noida | 19% | 8% |
| Gurugram | 17% | 7% |
| Greater Noida | 16% | 2% |
Delhi is the National Capital Territory of Delhi, all 13 of its districts. Ghaziabad is Ghaziabad tehsil. Faridabad is Faridabad tehsil. Noida is Dadri tehsil, which the map calls Noida. Gurugram is Gurgaon tehsil. Greater Noida is Gautam Buddha Nagar tehsil, which the map calls Greater Noida.
Greater Noida is really two places with a long gap between them. Coming from Noida, the columns are tallest in Noida’s older sectors. In Greater Noida West, around Gaur City, they’re shorter, because the new towers stand in land that is still mostly empty: most of the land within a kilometre of Gaur City isn’t built on yet. Then the columns drop away into a long stretch of fields and empty plots, and when the city starts again near Knowledge Park and the Alpha, Beta and Gamma sectors, they rise only about as high as at Gaur City.
The numbers
About 61% of the land within 1 km of Gaur City was not built up in 2020. This counts the 100-metre squares within 1 km of the point where OpenStreetMap places Gaur City, and how many of them were not yet built up that year; a square counts as built up once buildings cover more than a fifth of it.
The satellite pictures show how fast the first part happened. In 2005 the land around Gaur City was still fields. By 2020 it was a wall of towers, and almost all of it went up in those fifteen years.
From the street the difference is even clearer. At Gaur City you’re surrounded by tall towers on every side (opens in a new tab). A little further out, new towers stand on bare ground with nothing around them yet (opens in a new tab). In the old planned sectors like Alpha and Beta, the roads are wide (opens in a new tab), the plots are spread out on a grid, and trees and green belts fill the space between them. Both are part of Greater Noida, built by the same authority, but the columns show far more people living in the towers in the west than across the planned grid as a whole.
Gurugram spread too, on a bigger scale. By 2020 it had built on about 40% of its land, almost exactly as much as Delhi’s 42%. But it holds under 9,000 people on each km² of that land, against Delhi’s 31,500. From above it’s a broad spread of land built up from the late 1990s on, reaching from the old town to the Aravallis, with its tallest columns mostly around the DLF phases and Golf Course Road. Its people are catching up with its land: since 2000, Gurugram’s people per km² of built-up land rose by about half, faster than any of the six places.
So the land went outward while most of the people stayed in, but the five neighbours didn’t all grow the same way, and I wanted to know why one place fills up while the place next to it stays open.
Place by place
The five neighbours are really closer to a dozen places, each with its own edge: a river, a canal, a highway, or just the way it was built.
Delhi’s old west bank and its dense east
West of the river is the old capital and most of its planned colonies. East of it, from Shahdara up to Mustafabad, is where Delhi became densest. Little there changed colour after 1990, but its people more than doubled.
Ghaziabad’s old city, planned townships and unplanned neighbourhoods
East of the Hindon is the old city on the GT Road, with a centre and a history of its own. Between the Hindon and the Delhi border, trans-Hindon is really East Delhi carrying on into UP, and it splits again. Indirapuram, Vaishali and Vasundhara are planned townships, laid out by Ghaziabad’s development authority and UP’s housing board. Khoda, Loni and the old villages around Sahibabad grew the way North East Delhi did, plot by plot. Both halves ended up dense, the townships in blocks of flats, the rest on narrow lanes. On this map Loni and Khoda are among the densest places outside Delhi.
Noida’s first sectors, expressway towers and old villages
The sectors nearest Delhi were laid out first and stand taller. Further south, along the expressway to Greater Noida, the towers are newer and the land between them still wide. And inside the planned grid sit old villages like Harola and Nithari, which kept their own pattern of narrow lanes and dense houses.
Greater Noida’s planned grid and its tower cluster
The original Greater Noida is a wide planned grid around Pari Chowk, with low columns and lots of space between them. Greater Noida West, across the Hindon from Noida and meeting Ghaziabad at its edge, is a tight cluster of towers that rose out of farmland in the 2010s, and on the map it looks nothing like the planned grid next to it.
Gurugram’s old town, private city and new sectors
The old town around Sadar Bazaar is small and almost entirely built over. East of the highway are the DLF phases and Golf Course Road, the first private city. Further out, along the Dwarka Expressway and Sohna Road, are the newest sectors, built up but still filling.
Faridabad’s industrial town and Greater Faridabad
On one side of the Agra Canal, the old industrial town along the Mathura Road, from Old Faridabad to Ballabgarh. On the other, Greater Faridabad, most of it built up after 2000 and still more field than city.
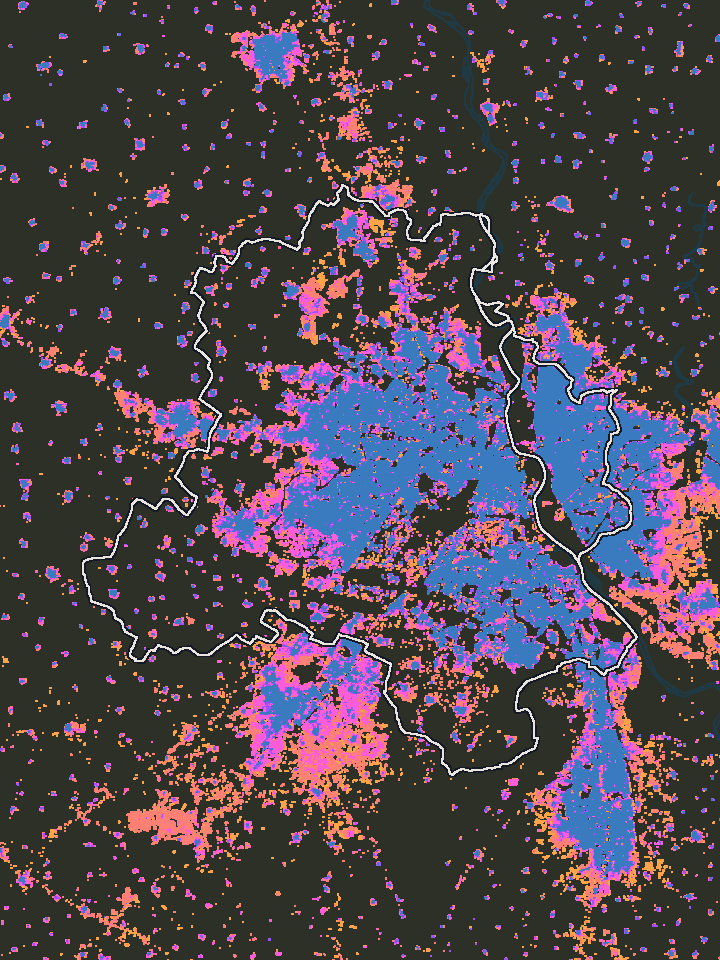
Delhi 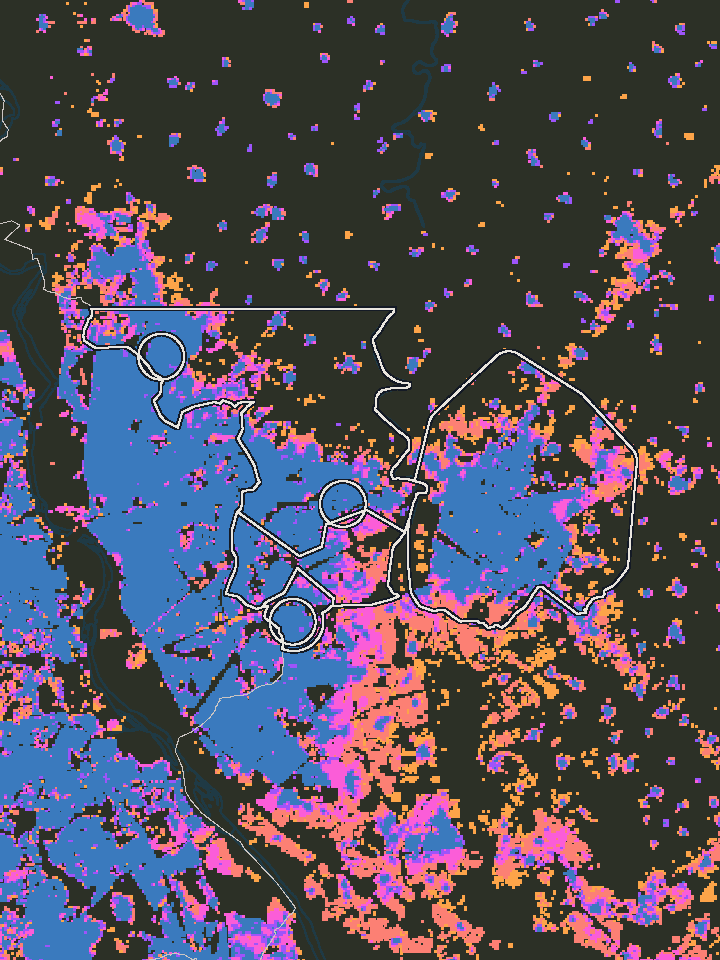
Ghaziabad 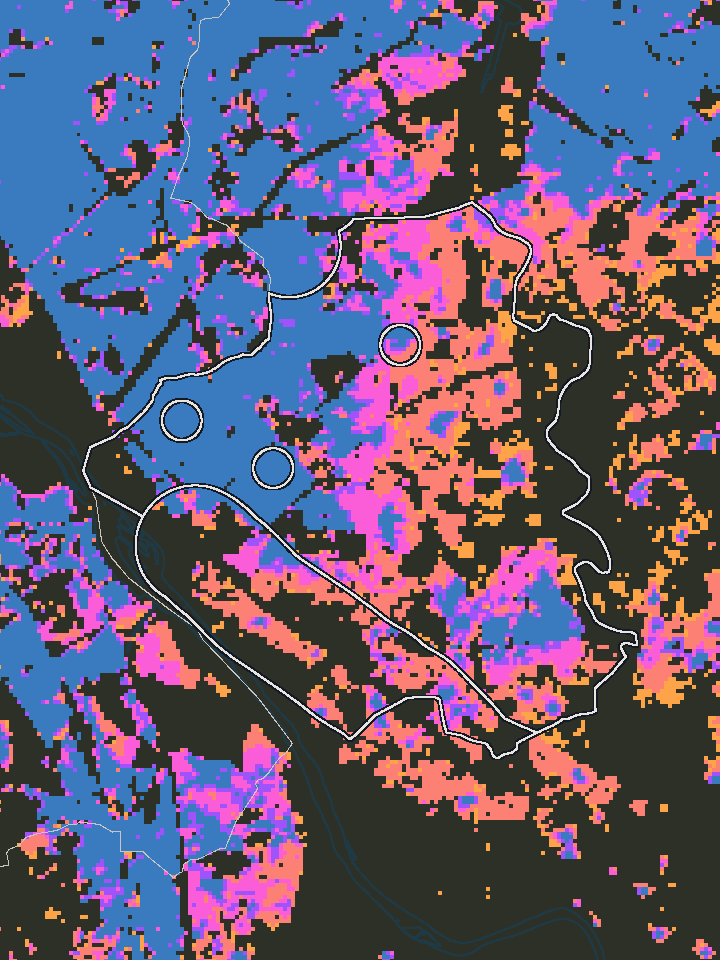
Noida 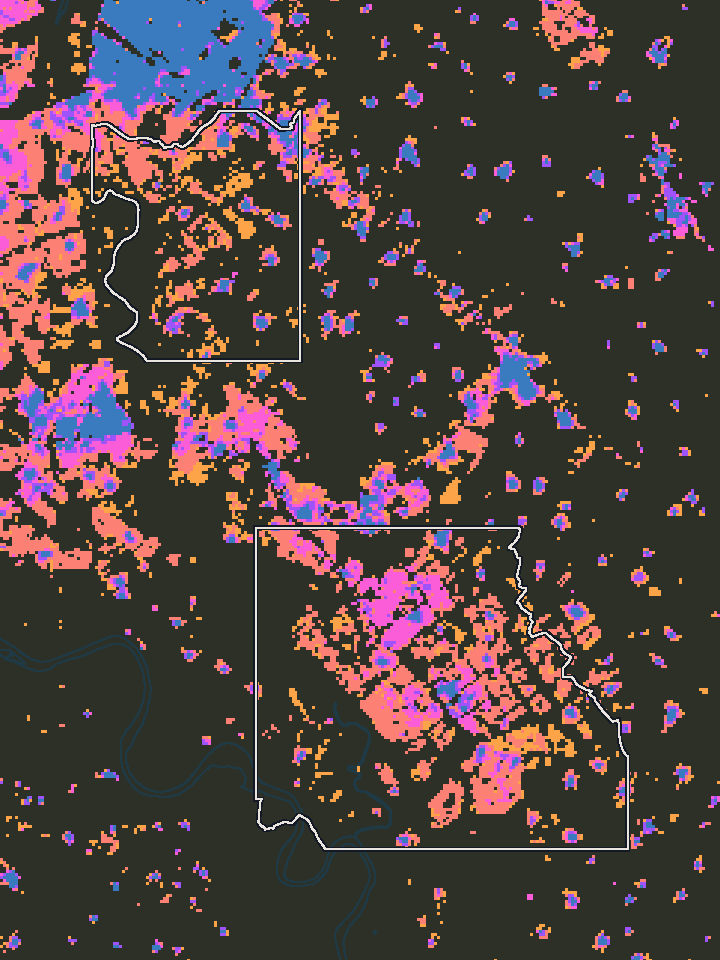
Greater Noida 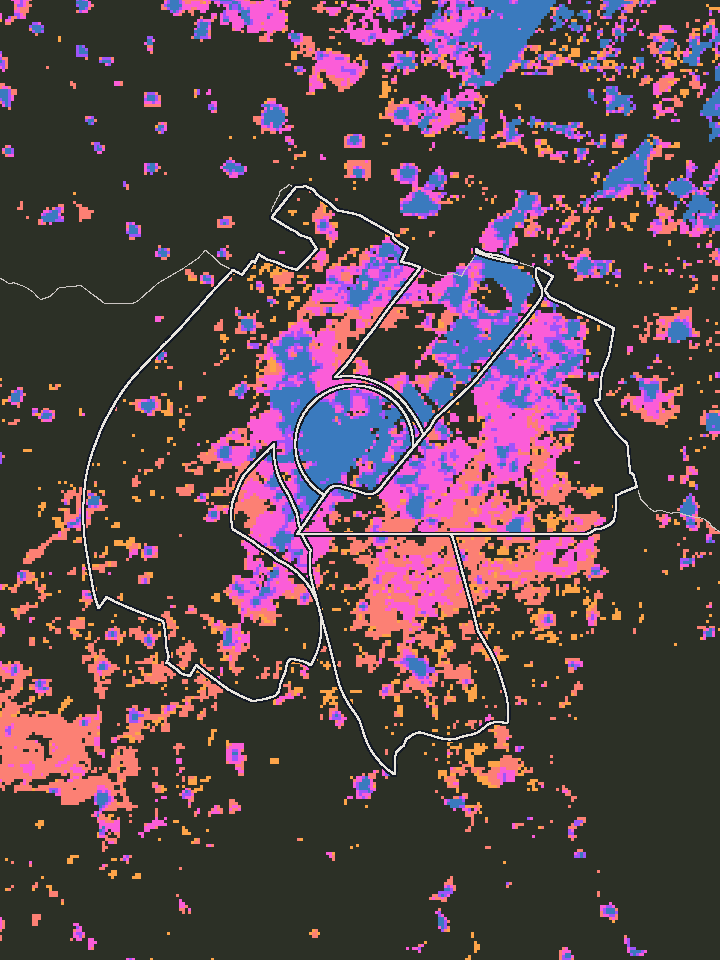
Gurugram 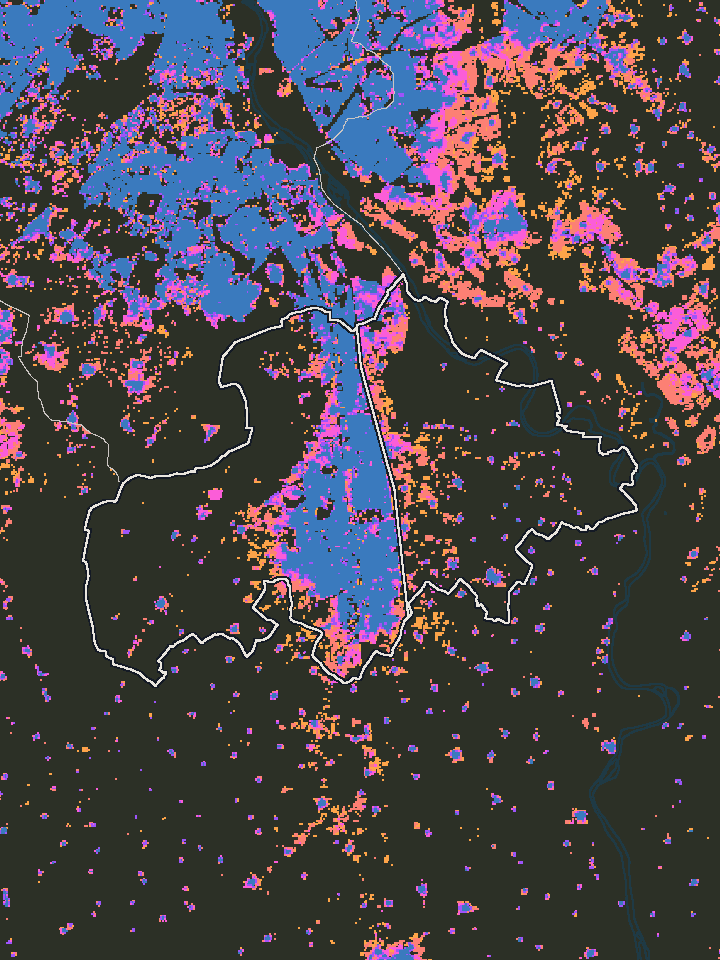
Faridabad
- Built by 1975
- 1975–1990
- 1990–2000
- 2000–2015
- 2015–2020
- After 2020
The same 1 km circle in two places, 2020
The numbers
| Circle | People on land built up after 2000 |
|---|---|
| Khoda | 1% |
| Pari Chowk | 48% |
The Khoda circle holds everyone within 1 km of the point where OpenStreetMap places Khoda. The Pari Chowk circle holds everyone within 1 km of Pari Chowk metro station.
What this data can and can’t tell us
When this essay says Delhi NCR, it means the 28 whole districts on the map, Delhi’s 13 and 15 around it in Haryana, Uttar Pradesh and Rajasthan, not the official National Capital Region.
Everything on this map is a model. It comes from GHSL, built by the European Commission’s Joint Research Centre. It supplies the data for the method the UN endorsed in 2020 to compare how countries urbanise. GHSL reads satellite pictures the same way for every year from 1975, finds the land that is built up, and spreads each census count across it.
Because the method never changes, the years can be compared directly, even though census boundaries keep changing. Hapur was carved out of Ghaziabad, Palwal out of Faridabad, and Delhi’s districts have been redrawn more than once, but a grid of 100-metre squares stays where it is, so a square in 1975 is the same square in 2020.
It sees built-up land, not what the buildings are used for. A housing society and a warehouse look the same to it. Between censuses its people are estimates, and 2025 and 2030 are forecasts.
Turn on the satellite view to see the ground itself, in the same year: fields where Dwarka would be in 1990, the first towers of Greater Noida West in 2015. The pictures from the 1970s are soft, because satellites then saw the ground in squares of 60 metres. They sharpen as the years go on. Where the picture and the model agree, the model is reading the ground well, and where they differ, trust the picture.
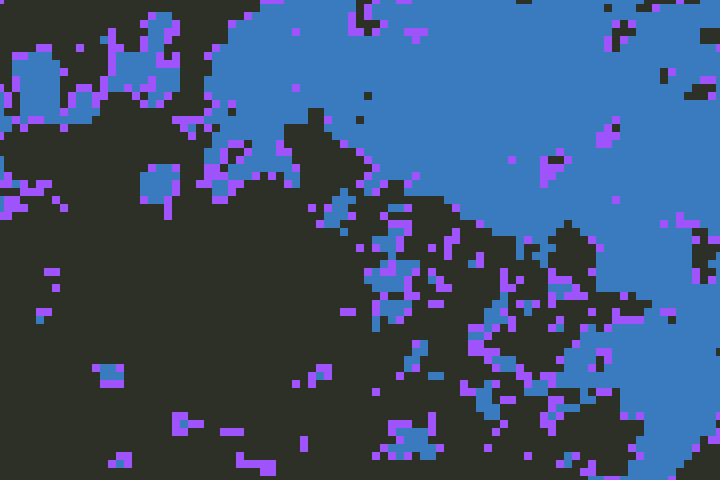
The model
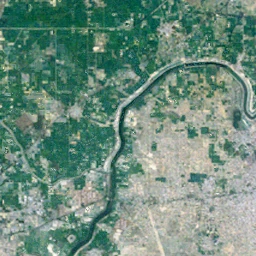
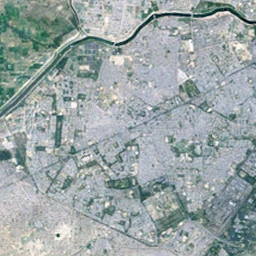
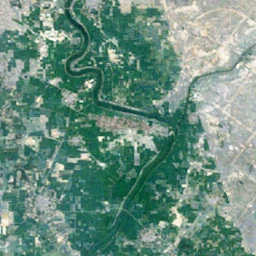
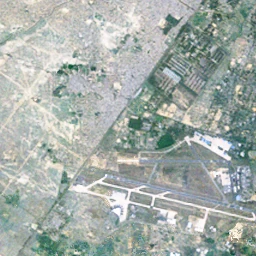
The satellite picture
How this map was made
To answer those questions I needed a map that showed every neighbourhood in every year, with numbers that anyone could check, and I couldn’t find one that did this for Delhi NCR, so I started building it.
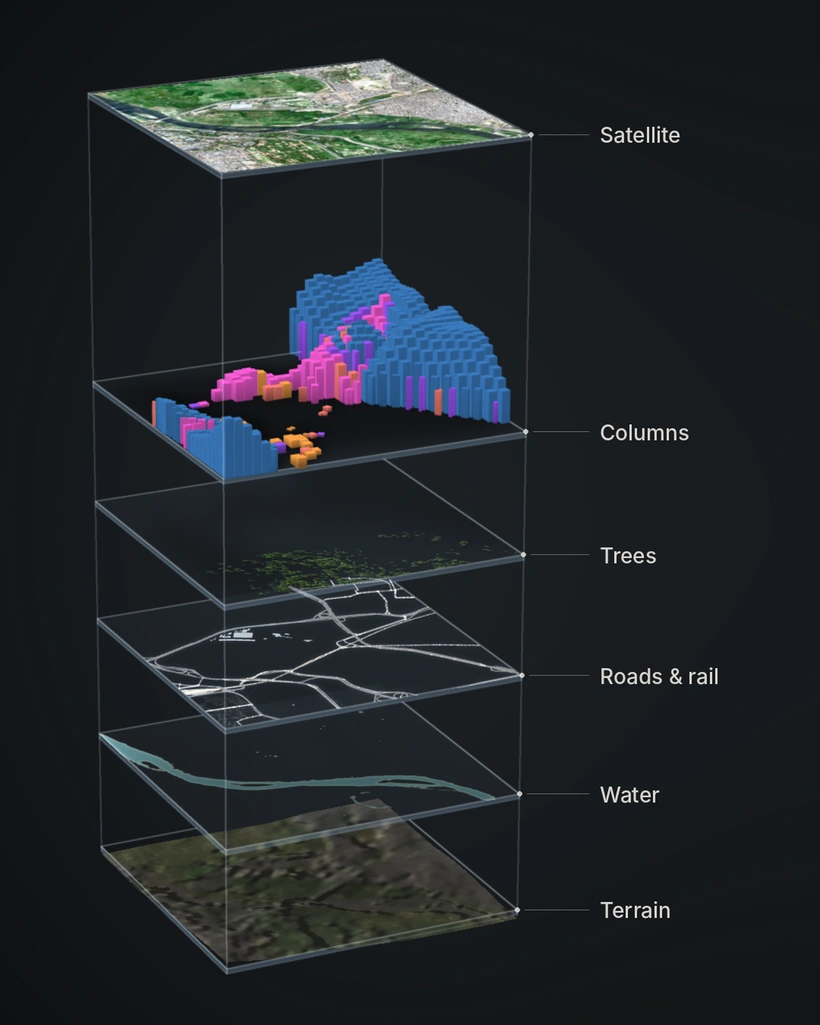
The data
The main data is the European Commission’s Global Human Settlement Layer. It estimates from satellite images how much of the land is built up and how many people live on it, every five years from 1975 to 2030, and the values for 2025 and 2030 are projections. For India its population numbers are based on the 2011 census, because that is the latest census with published results, so every population figure after 2011 is an estimate.
The rest of the map comes from other open datasets: roads, railways and boundaries from OpenStreetMap, land cover from ESA WorldCover, tree heights from Meta and the World Resources Institute, terrain from NASA’s NASADEM, and satellite pictures from Sentinel-2 and Landsat.
A few decisions about the data changed what the map can show. I count a square as built from the first year in which at least a fifth of it is built up, and I checked that the findings in this essay stay the same with a lower or higher cutoff. I also keep two kinds of density, people per km² of the whole area and people per km² of built-up land, because they can differ a lot for the same place, and the map always tells you which one you are looking at. For places, I didn’t want to stop at districts, so Ghaziabad for example is split into its old city east of the Hindon, the planned townships, and the unplanned neighbourhoods across the river.
The pipeline
All the data is reprojected onto one grid in UTM zone 43N, a projection where the squares are exactly 100 metres on each side. On a normal latitude and longitude grid the squares are slightly stretched, which would make area comparisons wrong. The grid has about four million squares, and for each one the pipeline works out the year it was first built and its population in every year.
The results aren’t stored as text files like JSON, because those would be far too big and slow to read. They are packed into small binary files, and the detailed layers are split into tiles, so close-up detail is only downloaded for the part of the map you are looking at. Each file’s name includes a fingerprint of its contents, so a browser can keep it cached safely until the data actually changes.
Roads took the longest to get right. The squares don’t know where roads run, so at first the city looked like one solid mass. Now the roads and railways from OpenStreetMap are cut through the columns at their real widths, which I checked against satellite pictures in places where widths can be measured, and bridges are drawn above the ground. Rivers, canals and ponds come from their own data, and trees are only drawn where the data is confident that a tree is there. The satellite pictures are sharpened as much as the data allows, but free satellite imagery doesn’t go sharper than 10 metres, so the map can’t either.
The whole pipeline can be rebuilt from the public sources, and each release is packed so that the same inputs give the same file, checked by its checksum.
The renderer
The map is drawn with WebGL2, which lets the browser use the phone’s graphics chip directly. Loading and unpacking the data happens in a background worker, so the page keeps responding while the map fills in. Every built-up square is a column, and the columns are drawn with instancing: the graphics chip gets one column shape and a list of positions, heights and colours, and draws them all in a few calls instead of one call per column. Tiles near the camera get more detail than distant ones, and distant rows are pre-filtered so they don’t flicker as you move.
Time is a single number passed to the graphics chip. Every column already knows the year it was built, so moving through the years doesn’t rebuild anything, and each square simply rises in its own year.
I kept the ground at its true height, even though Delhi is very flat and exaggerating the terrain would have looked more dramatic. I also used one soft light without cast shadows, because shadows made the columns behind them hard to see.
The tools
You can compare up to eight areas, chosen by name, as a district or tehsil, as a circle around a point, or as a shape you draw. To add an area up, the map finds which squares fall inside the shape and sums them, and running totals prepared in advance make that fast enough to feel instant, even for a whole district. It can show six measures, grouped as how many people live there, how much is built, and how recently it was built, and there are other views for density from a centre outward, for comparing two groups, and for what stands out in an area. When you tap the map, it traces a line from your finger into the 3D scene to find the exact spot on the ground, then reads that spot. You can also switch to the satellite picture of any year, or open Street View at that point.
Everything you can set on the map lives in one place in the code, and the page address is written from it, so every view has its own link. This essay talks to the map through the same state, which is how each step opens in the full map exactly as it was. The numbers in the text come from the same code that draws the map. Before anything is published, thousands of automated checks run in a real browser, and timing tests check the map stays smooth on a phone with its processor slowed down four times. The site isn’t published if a number in a sentence doesn’t match its chart.
If you find something that looks wrong, please tell me.
Find your own place
Type the name of your town, locality, village, sector or metro station. Many housing societies are in the list too, though not all. The map goes there and shows when that land was built up, how many people live on it now, and how both changed over the years.
From there you can compare it with another place, or draw your own shape around the streets you know. You can also set the year to when your family moved in and turn on the satellite view, to see what was there then.
Open the full map and look for your place there.
The full map
Everything in this essay comes from one map, and the essay covers only a small part of it. The map has every district and tehsil, any area you draw, people per km² by distance from any point, and the satellite pictures for every year.
If someone once told you about a field that is now houses, you can look it up there and see when it was built on.
Open the full map at DwarkaSee Dwarka in Street View (opens in a new tab)About 111 MB; it runs best on a computer or a recent phone.
Data: GHSL (European Commission, Joint Research Centre), OpenStreetMap contributors, ESA WorldCover 2021, Meta and WRI canopy heights, EC JRC/Google Global Surface Water, Wikidata, GeoNames, NASADEM, Landsat (U.S. Geological Survey) and Copernicus Sentinel-2. The code that builds its OpenStreetMap layers is on GitHub. Made by Avarta.
If this piece was worth something to you, you can support the next one (opens in a new tab).
Sources
- Pesaresi, M., and Politis, P. (2023). GHS-BUILT-S R2023A: GHS built-up surface grid, derived from Sentinel-2 composite and Landsat, multitemporal (1975–2030) [Dataset]. European Commission, Joint Research Centre. doi:10.2905/9F06F36F-4B11-47EC-ABB0-4F8B7B1D72EA. The JRC catalogue currently cites it as 2026, with the added identifier 10.2905/JRC.939FACR.
- Pesaresi, M., Schiavina, M., Politis, P., Freire, S., Krasnodębska, K., Uhl, J. H., et al. (2024). Advances on the Global Human Settlement Layer by joint assessment of Earth Observation and population survey data. International Journal of Digital Earth, 17(1). doi:10.1080/17538947.2024.2390454
- Schiavina, M., Freire, S., Carioli, A., and MacManus, K. (2023). GHS-POP R2023A: GHS population grid multitemporal (1975–2030) [Dataset]. European Commission, Joint Research Centre. doi:10.2905/2FF68A52-5B5B-4A22-8F40-C41DA8332CFE. The JRC catalogue currently cites it as 2026, with the added identifier 10.2905/JRC.CXKEDRR.
- United Nations Statistical Commission (2020). Report on the Fifty-first Session (3–6 March 2020), E/2020/24–E/CN.3/2020/37, decision 51/112(i), p. 22. unstats.un.org. With the method: European Commission, ILO, FAO, OECD, UN-Habitat and World Bank (2020), A Recommendation on the Method to Delineate Cities, Urban and Rural Areas for International Statistical Comparisons. unstats.un.org
- Delhi Development Authority (scheme introduced 2019). PM-UDAY Scheme. dda.gov.in. And: Prime Minister's Office (8 November 2019), Prime Minister meets RWA office bearers and members of Unauthorised Colonies of Delhi, Press Information Bureau. pib.gov.in
- Angel, S., Blei, A., Parent, J., Lamson-Hall, P., and Galarza Sánchez, N., with Civco, D. L., Lei, R. Q., and Thom, K. (2016). Atlas of Urban Expansion, 2016 Edition. Volume 1: Areas and Densities. New York University, UN-Habitat and Lincoln Institute of Land Policy. lincolninst.edu
- Delhi Development Authority (1962). Master Plan for Delhi. Approved under section 9(2) of the Delhi Development Act, 1957; published 1 September 1962. dda.gov.in
- Government of Uttar Pradesh. NOIDA: “set up in 17 April 1976 under the UP Industrial Area Development Act 1976”. umd.nic.in/noida
- Government of Haryana (1975). The Haryana Development and Regulation of Urban Areas Act, 1975, Haryana Act No. 8 of 1975. Haryana Government Gazette (Extraordinary), 30 January 1975. Consolidated text, with later amendments
- © OpenStreetMap contributors. Boundaries, rivers, roads, railways, canals, forests, parks, water and place names, and the outlines of the essay's places. Licence: Open Database License (ODbL). openstreetmap.org/copyright
- NASA JPL (2020). NASADEM Merged DEM Global 1 arc second V001. NASA Land Processes Distributed Active Archive Center. doi:10.5067/MEASURES/NASADEM/NASADEM_HGT.001
- © ESA WorldCover project 2021 / Contains modified Copernicus Sentinel data (2021) processed by ESA WorldCover consortium. Zanaga, D. et al. (2022). ESA WorldCover 10 m 2021 v200. doi:10.5281/zenodo.7254221. Licence: CC BY 4.0.
- Meta and World Resources Institute (WRI), High Resolution Canopy Height Maps. Licence: CC BY 4.0. Tolan, J. et al. (2024). Very high resolution canopy height maps from RGB imagery using self-supervised vision transformer and convolutional decoder trained on aerial lidar. Remote Sensing of Environment 300, 113888. doi:10.1016/j.rse.2023.113888
- Source: EC JRC/Google. Pekel, J.-F., Cottam, A., Gorelick, N. and Belward, A. S. (2016). High-resolution mapping of global surface water and its long-term changes. Nature 540, 418–422. doi:10.1038/nature20584
- Wikidata (CC0). wikidata.org
- GeoNames. Licence: CC BY 4.0. geonames.org
- Satellite pictures: Landsat imagery courtesy of the U.S. Geological Survey. Contains modified Copernicus Sentinel data 2020 and Contains modified Copernicus Sentinel data 2025. Read from Microsoft's Planetary Computer. The rivers' channels and the fields' grid on the map's ground: Contains modified Copernicus Sentinel data (2020).
Credits
- Built-up land and people, from the European Commission's Joint Research Centre. © European Union, 2023. Licence: CC BY 4.0. Modelled estimates, not counts. Changed here: resampled to a 100 m grid in UTM zone 43N and limited to the map's 28 districts, with first-built dates and the map's figures worked out from it.
- Boundaries, rivers, roads, railways, canals, forests, parks, water and place names. Licence: Open Database License (ODbL). Credit: © OpenStreetMap contributors.
- Streets, roads, railways, water and landmarks: OpenStreetMap, as above (the roads and railways from Geofabrik's extracts of OpenStreetMap). Credit: © OpenStreetMap contributors, ODbL. The streets are simplified for the page.
- Land cover: ESA WorldCover 2021 v200, at 10 m: tree cover, shrubland, grassland, cropland, bare ground, wetland and water. Licence: CC BY 4.0. Credit: © ESA WorldCover project 2021 / Contains modified Copernicus Sentinel data (2021) processed by ESA WorldCover consortium.
- Trees: Meta and World Resources Institute (WRI), High Resolution Canopy Height Maps, at 1 m: each tree where the map sees a crown 2 m high or more, at its own place, height and width. Licence: CC BY 4.0. Citation: Tolan, J. et al. (2024).
- Rivers' channels and the fields' grid: Copernicus Sentinel-2, the dry season of 2020. Credit: Contains modified Copernicus Sentinel data (2020).
- Water seen 1984 to 2024: JRC Global Surface Water v1.5, how often each place was seen as water. Free and open, with acknowledgement. Credit: Source: EC JRC/Google.
- Landmarks: chosen by rule from OpenStreetMap's named places and how many Wikipedia editions write about them, through Wikidata (CC0). Credit: Wikidata (CC0).
- Terrain. Openly shared without restriction, read from the OpenTopography public mirror. NASA JPL. (2020). NASADEM Merged DEM Global 1 arc second V001.
- Place names for the search, beyond OpenStreetMap's: GeoNames (Licence: CC BY 4.0. Credit: GeoNames) and Wikidata (Licence: CC0).
- Satellite pictures, 1975 to 2015: Landsat 2, 3, 5, 7 and 8. Credit: Landsat imagery courtesy of the U.S. Geological Survey.
- Satellite pictures, 2020 and 2025: Copernicus Sentinel-2. Credit: Contains modified Copernicus Sentinel data 2020 and Contains modified Copernicus Sentinel data 2025.
- Served with the map: Inter, © The Inter Project Authors, SIL Open Font License 1.1; mp4-muxer, © Vanilagy, MIT. Their licences are in the map's files (vendor/).
- The code that builds the map's OpenStreetMap layers is on GitHub (AGPL-3.0); the map's images and text are CC BY 4.0, credit @Aavartaa.